Data Model for Personal Finances

When I moved to Toronto in 2023, I faced many new challenges:
- “What would my household’s net income be after taxes?”
- “What is the most profitable way to leverage registered accounts such as TFSA, FHSA, RRSP, and RESP?”
- “How can I unify income and spending in Canadian dollars if the Bank of Canada doesn’t provide all the exchange rates I need?”
Services like TurboTax had neither the data-source integrations nor the scenario forecasting capabilities I needed.
Data is only as useful as its ability to influence the future—not merely measure the past.
The more I talked with CPAs, the more questions arose. Although these questions were data-related, they were not easy to answer. Many required assumptions based on predictions about things I had never done before.
Back then, I made a decision that saved me a lot of time in the years that followed: I started with the foundation.
Although I didn’t yet know all the questions I would need to answer, I drew a data model in Google Sheets. It was nothing more than a conceptualization of “what kind of data will I be dealing with?”

I selected Google BigQuery for data storage primarily because all my scripts were written in Apps Script, which integrates smoothly with BigQuery and allowed me to remain serverless.
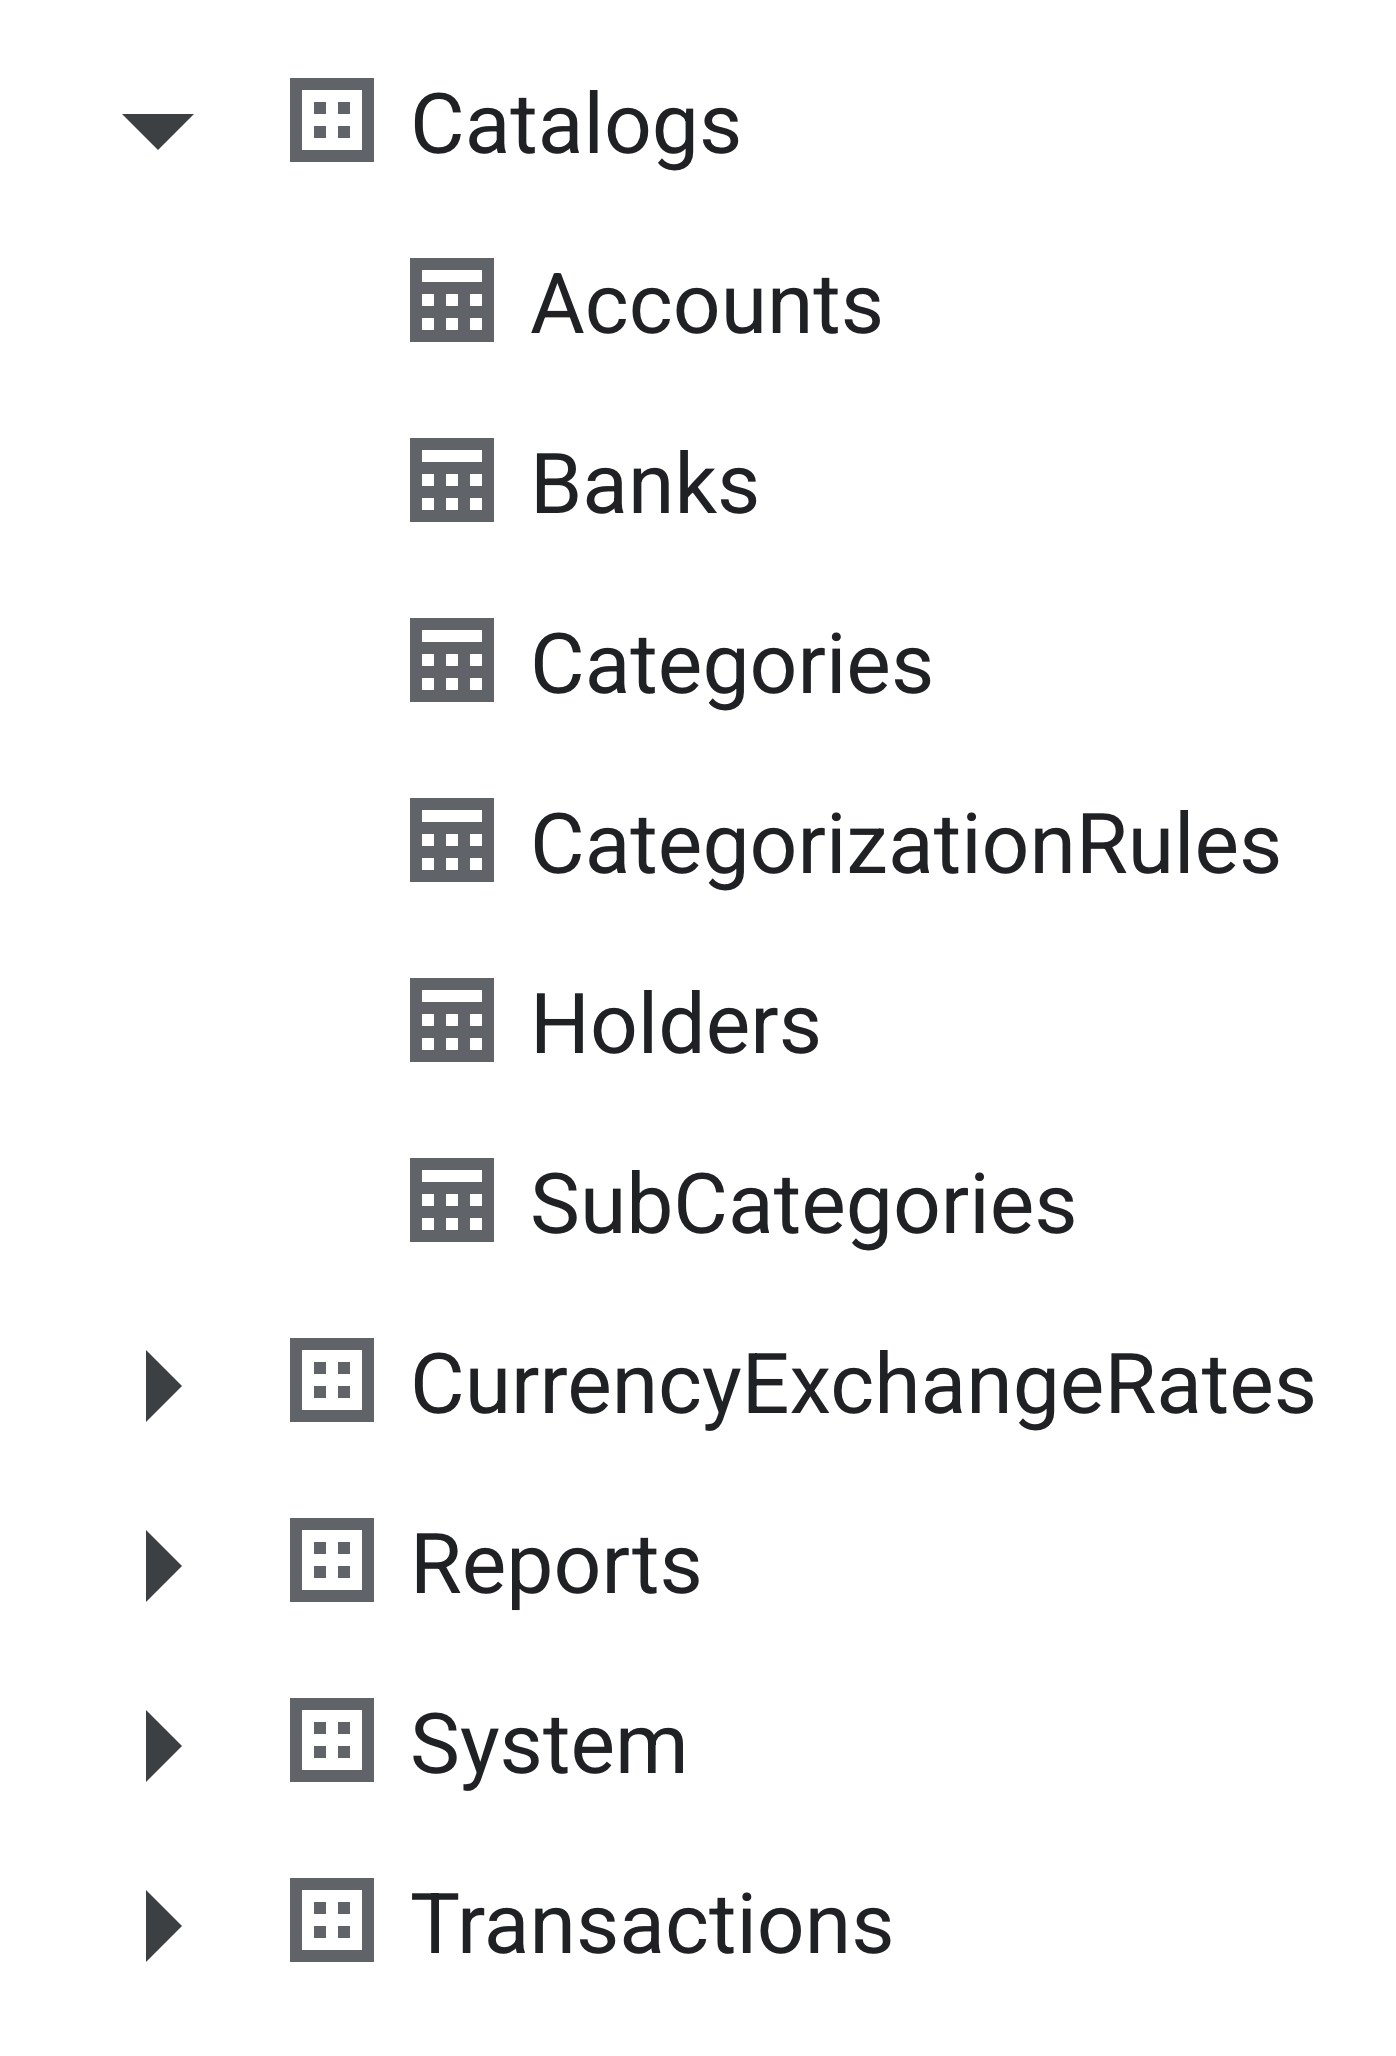
Back in 2023, all queries were written by hand, but they were relatively simple. And this setup worked perfectly for me for three years!
However, some questions kept bothering me and remained unanswered:
- “What is my total spending on subscription services?”
- “What is the real cost of FX transactions?”
- “Did I receive a refund for my recent return?”
Although I had all the data required to answer these questions, they were not important enough to justify spending time writing ad hoc SQL queries.
And this is where AI came into play.
Without making a single change to the existing data schema, I connected the data to MCP and received not only answers directly on my phone, but also a governed layer where I could define join keys and business-friendly field names—and review the readable SQL behind every answer.
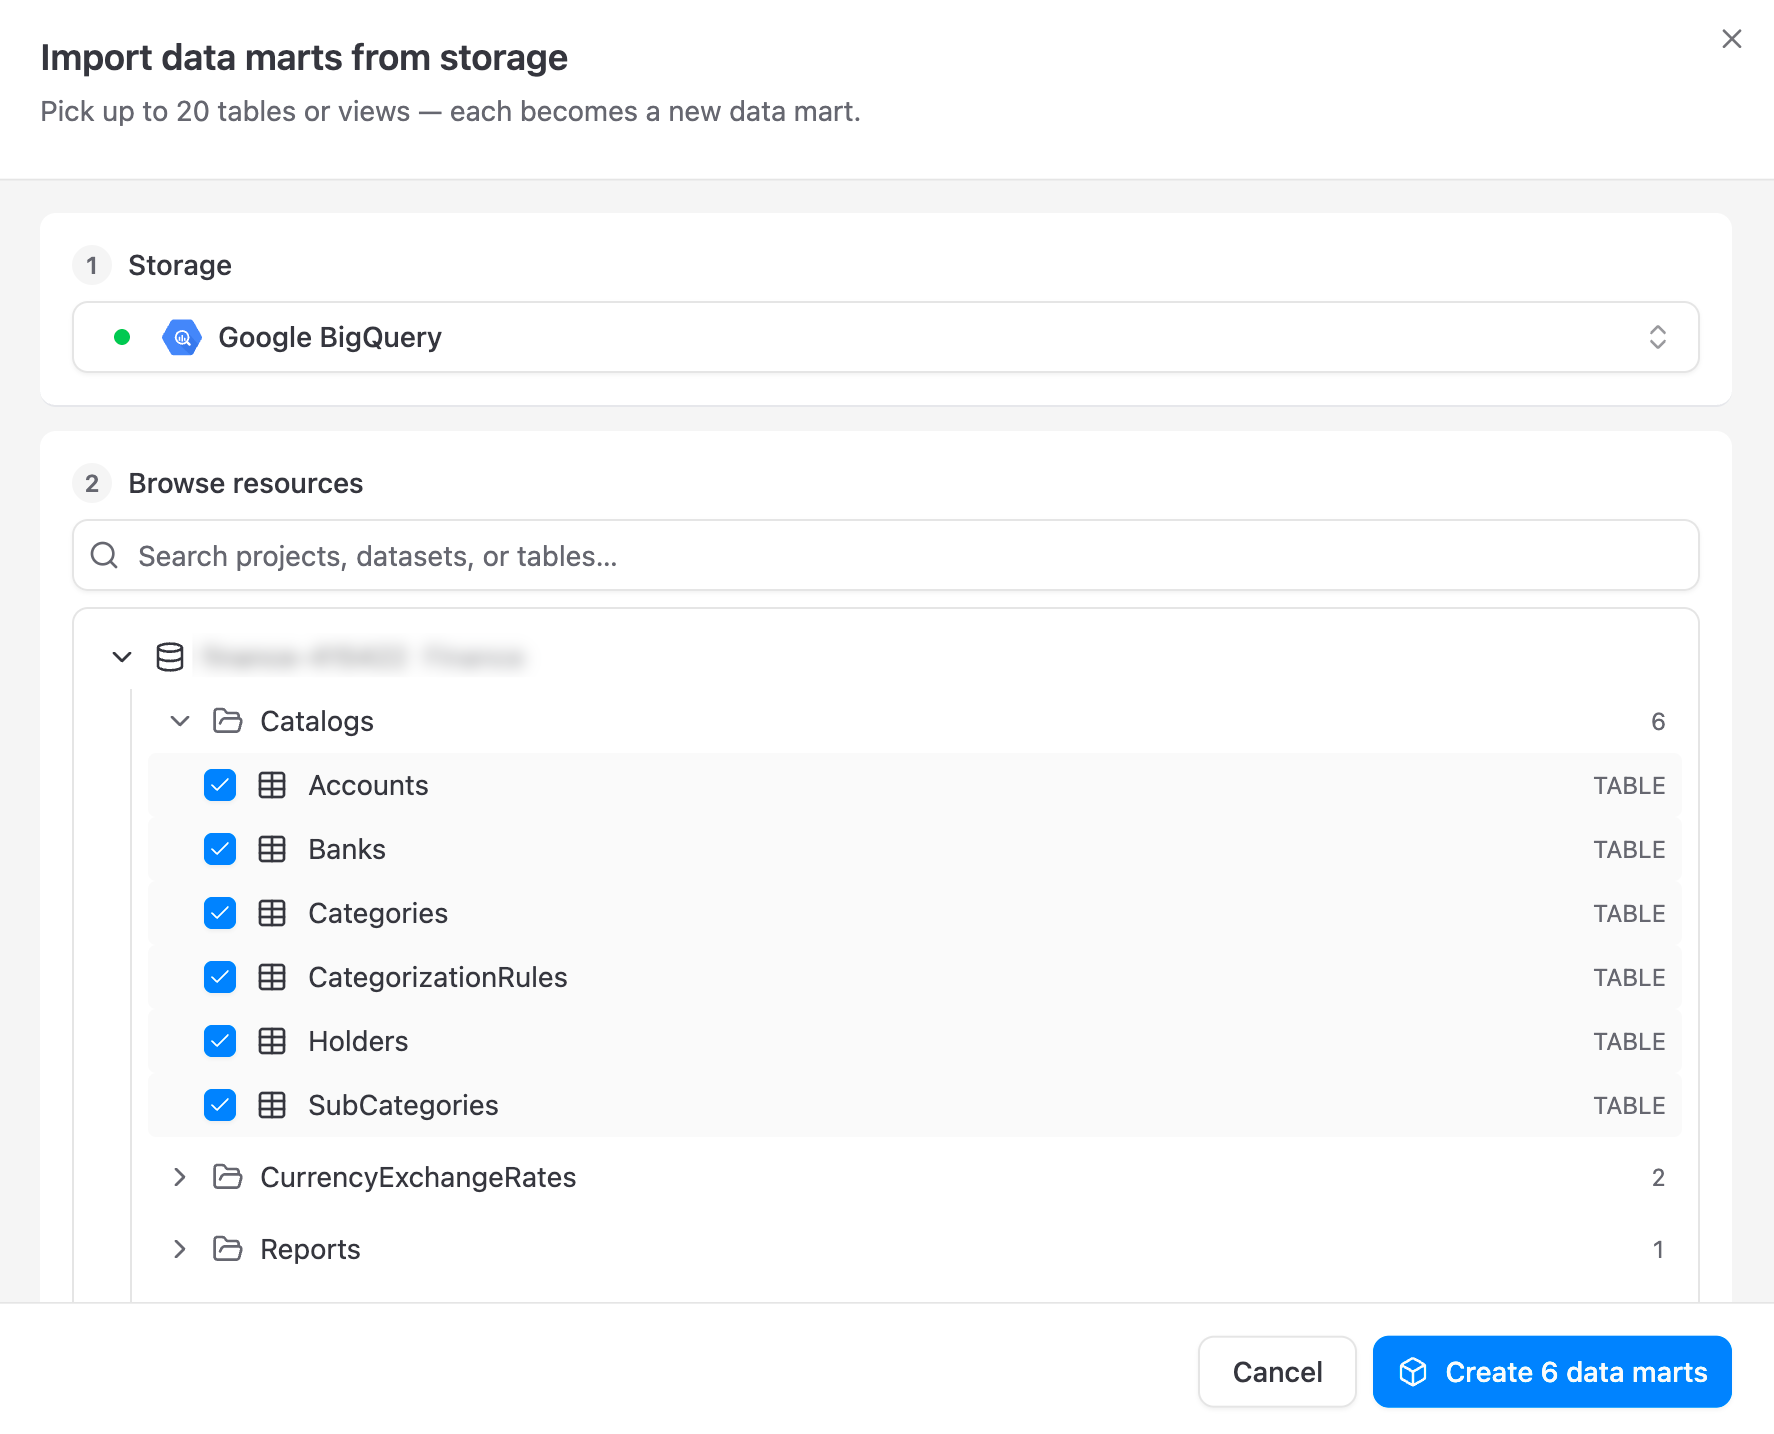
Personal finance is the last area where I want to deal with hallucinations or misinterpretations. So, I finally migrated the data model from Google Drawings to an interactive canvas in OWOX Data Marts.
As a bonus, an interactive dashboard was generated out of the box. In three years, I had never found the time to build one from scratch in Looker Studio :)
Next on my wish list is automating weekly insights based on predefined prompts.
I was surprised to discover how much banks actually charge through all their fees and commissions. And I believe this is far from the only surprise hidden in my data.