Data Modeling. Where to Start

Data modeling has been around for decades. But experts advocating for it often sound like Don Quixote — for businesses, it has never been a priority, and many data analysts don't know where to start.
Today, semantic layers, OKFs, and ontologies are becoming essential for enabling agentic analytics. That's why I decided to share my personal experience with data modeling that helped me align stakeholders and data teams around data modeling ROI and business objectives many times.
As a data guy, I am familiar with SQL and data analysis. But I am definitely not the best at writing complex queries from scratch.
As a CEO, I am familiar with business challenges. But I am definitely not great at running a multi-million-dollar business (hopefully not yet).
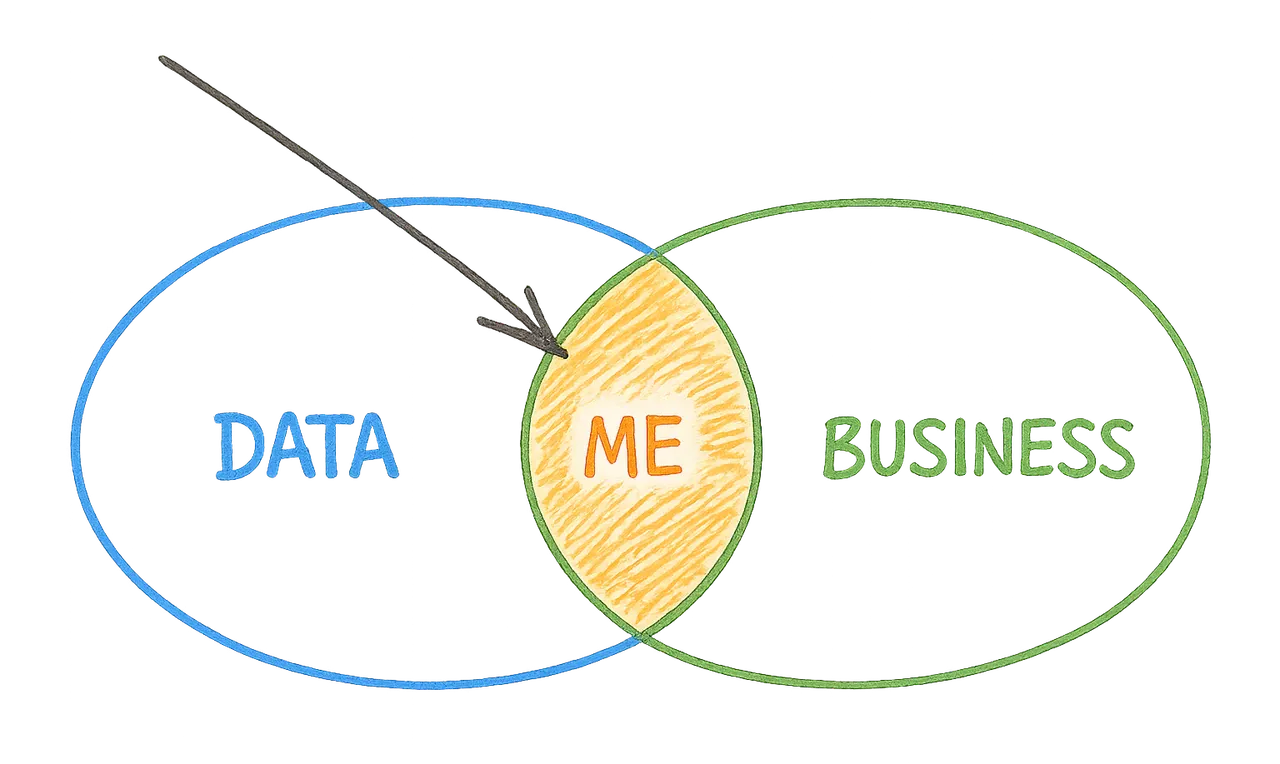
However, I believe I am in the top 1% of CEOs in SQL, and in the top 1% of data analysts in business development.
So, in this article, I'll do my best to marry both worlds: business and data.
Here are three simple steps I went through to build a data model for a new customer from scratch.
1. Start with the goal
As always, the best place to start is by asking yourself:
- What is the goal?
- What will success look like?
- How will we measure it?
It might be "Generate $X in revenue this quarter" or "Become profitable by the end of the year."
Let’s pick one metric — revenue, net profit, or new customers. It will become your KPI #1.
2. Identify constraints
The next question is: what is a reasonable cost to achieve KPI #1, and how do we measure it?
Most businesses which I worked with have a fixed budget or a flexible one — ROI, ROAS, or CAC. Whatever it is, there is always a resource that constrains your ability to achieve KPI #1.
That becomes KPI #2.
3. Draw the business entities (not data tables!)
Last but not least, drawing all the nouns mentioned in discussion on how KPI #2 (investment) is connected to KPI #1 (outcome).
For example:

There you have it — your first data model.
It’s not a concrete report. It’s something much better: a data model that enables as many ad hoc reports as you need while ensuring they align with your business objectives.
With self-service analytics software, you can then generate as many ad hoc reports as you need. More importantly, you can get the answers exactly when you need them.
Next steps
Once the first report is ready, there is a “why”. I prefer to start by adding «dimensions» to unlock segmentation:
- What kind of customers? Oh, we have new and returned ones — let’s add "loyalty_group" as dimension to find acquisition campaigns for customers with the highest LTV.
- Or what products’ sales are increasing and which are declining? To answer, we need “Product Category” as product dimension.
This process is an ongoing process as well as satisfying curiosity.