When will I get my money back?
First question

For most CEOs — especially those without a data analytics background — it's hard to settle on target values for metrics like CAC, ROI, or CPA. But it's easy to answer one question:
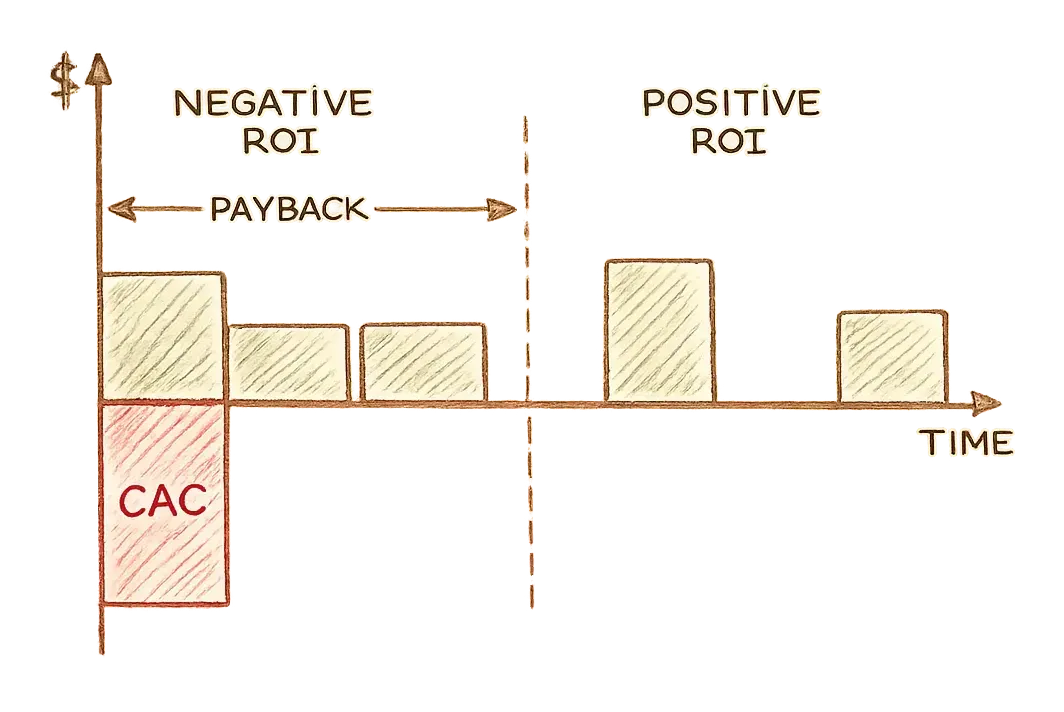
How long are you willing to wait to get your investment back?
The metric that answers this is payback, and most other metrics should be built on top of it. So it's the first question every business owner should ask a data analyst: "When will I get my money back?"
As simple as that. Before payback, your ROI is negative; after it is positive. The more you invest and the shorter your payback is, the faster the business grows. That's why payback is the first metric a CEO needs to tell whether the business is making or losing money, growing or shrinking.
At this stage the stakeholder has done their job for now. It's time for the data analyst to step in, whom I hope you’ve already hired.
How to calculate payback
To calculate payback we need only two parts:
- Customer acquisition cost
- Average monthly gross profit per customer
This is a well-known formula you can find on plenty of sites, like shopify1.
Done? Not so fast.
- As a good data analyst, you should ask yourself: "How will this report be used? What decision will it drive?" And it turns out that to drive a decision, you need this data segmentable — at least at the campaign level. "Your payback is 3 months" isn't actionable, because what your boss really wants is to generate profit faster, find more loyal customers, and stop the campaigns handing out coupons to returning customers who'd have bought anyway.
- Transactional businesses, unlike subscription-driven ones, can't extrapolate revenue from the first order across the coming months and call it monthly revenue
- And acquisition isn't a one-time cost: customers keep clicking on paid ads, and you keep paying affiliates who bring back loyal customers.
This is the moment you start to smell attribution in the air. Most businesses either never get past last-click, or overcomplicate things and lose transparency and trust. So below I'll share a straightforward approach — easy to implement and reasonable for most businesses. Feel free to complicate it as much as you like.
First, let's take an orders data mart:
| Order ID | Order Date | Customer ID | Acquisition source | Net Sales |
|---|---|---|---|---|
| 1234 | Jun 7, 2026 | 1 | Facebook Campaign 1 | $100 |
| 1235 | Jun 8, 2026 | 2 | Facebook Campaign 1 | $90 |
| 1236 | Jun 9, 2026 | 3 | Google Search Brand | $140 |
| 1237 | Jun 11, 2026 | 1 | Facebook Campaign 2 | $85 |
| 1238 | Jun 12, 2026 | 4 | Google Search Brand | $60 |
Two notes here:
- Net Sales, not Revenue. Even if you don't know the cost of each good sold, deducting coupons and applying an average margin per category beats nothing.
- For the acquisition source, you don't want "paid" or "non-direct" — you want "manageable." A report is only as actionable as it is easy to act on. There's no reason to treat email as an acquisition source unless you're a spammer. For most businesses, manageable equals paid — but not always.
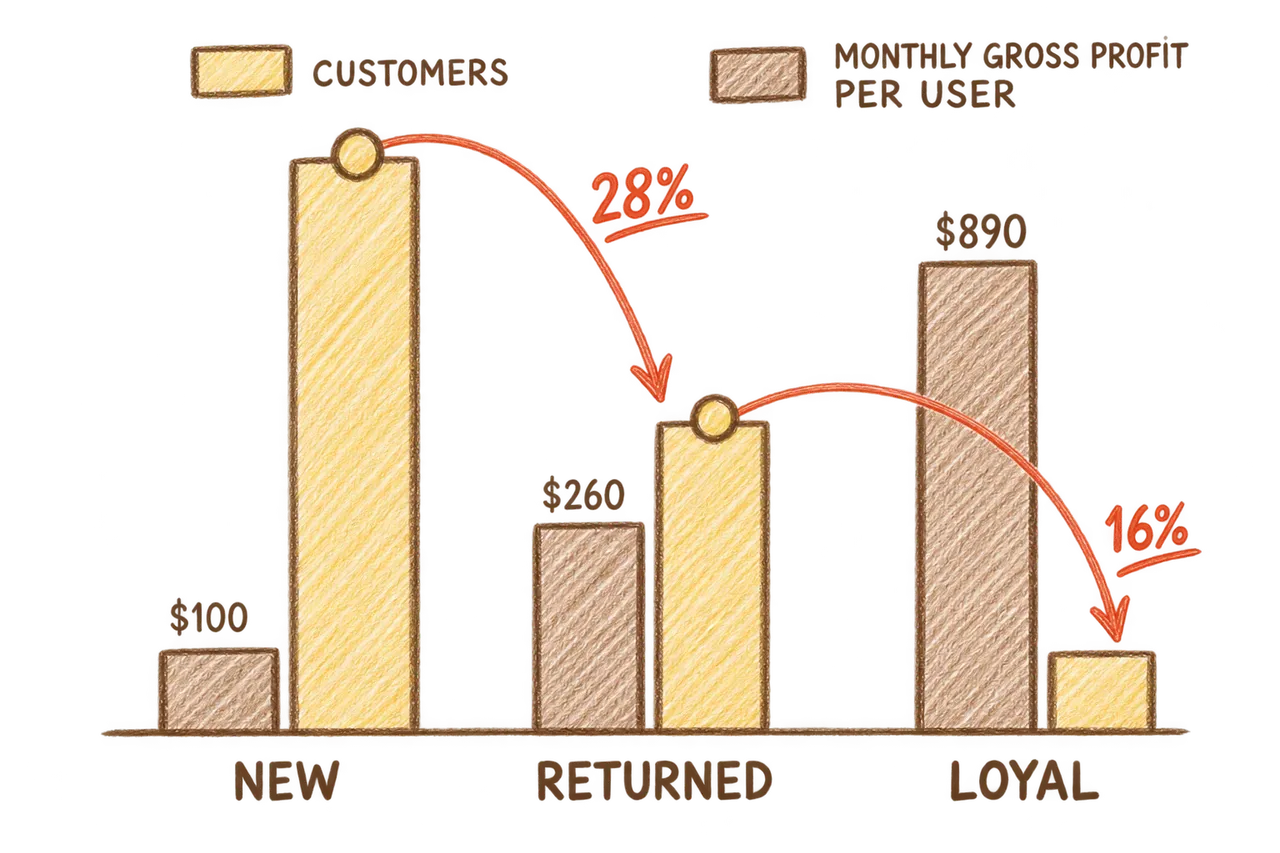
Now the most interesting part. Next we need to estimate the fair incremental value of each order actually being placed. New and returning customers obviously aren't equally valuable to the business — and paying as much for a loyal customer as for a new one makes no sense. The challenge is finding a method that's accurate and trustworthy at the same time.
I hope some business users, not only data analysts, have read this far. So I'll limit myself to naming purchase-cadence modeling2 as the most straightforward, SQL-friendly method for businesses with thousands of online conversions a year. In my experience, advanced methods like conversion lift, Markov chains, and Bayesian models increase accuracy without improving the quality of the decision. Either way, it doesn't matter whether a channel shows a 96.5- or an 84.3-month payback — you need to review it, because right now you're losing money.
The point is, you need only two probabilities:
- A customer will place a returning order anyway: new → returning
- An order will be placed by an already-loyal customer: returning → loyal or loyal → loyal
The definition of a loyal customer is up to you — usually something like "X+ orders within a year at an AOV of Y$ or higher." You might think about these segments like this:
- New — welcome aboard, we hope you'll stick with us along the way!
- Returning — we've got a lot in common; let's do everything to keep this relationship long-lasting.
- Loyal — made for each other; we're glad you find our price and quality the best on the market.
Pay attention:
- Loyalty is an order dimension, not a customer dimension. If a customer places a second order, the first order won’t stop being “New”. However, it might also be useful to calculate the customer’s loyalty segment based on their most recent order’s segment.
- The more segments you create, the less data you have behind each accurate calculation. As an optional improvement, I'd consider splitting the calculation by territory, if you have several.
As a result, you should extend the orders table with the following calculated columns:
| Order Id | Order Type | Attributed Ad Cost | Incremental Share | Attributed Value |
|---|---|---|---|---|
| 1234 | New | $120 | 100% | $100 |
| 1235 | New | $110 | 100% | $90 |
| 1236 | Returning | $40 | 72% | $98 |
| 1237 | Returning | $95 | 72% | $60 |
| 1238 | Loyal | $35 | 56% | $12 |
And, finally, you’ll get a report like this:
| Campaign | Net Sales | Attributed Ad Cost | Attributed Value | ROAS | Payback, month |
|---|---|---|---|---|---|
| Facebook Campaign 2 | $85 | $95 | $60 | 63% | 3.6 |
| Facebook Campaign 1 | $190 | $130 | $155 | 119% | 2.2 |
| Google Search Brand | $200 | $75 | $110 | 147% | 9.7 |
Pay attention: the campaign with the highest ROAS doesn’t necessarily have the shortest payback.
Now you have an answer to both questions: when will I get my money back? (payback), and where to start optimizing your campaigns (ROAS). And, most importantly, you can refocus your resources on growing your business, not just paying ad platforms for “assisted conversions with positive ROI.”
| Dimension | Before | After |
|---|---|---|
| Strategy What you optimize for | Monthly results — keep best-performing campaigns | Long-term growth — acquire loyal customers |
| KPI how you judge investment efficiency | ROAS | ROAS & Payback |
| Revenue measure what counts as money in | Revenue | Net Sales |
| Order value what an order is worth | All equal | New / returning / loyal |
| Acquisition cost when you pay for a customer | One-time | Ongoing |
| Attribution how you read a campaign | Last-click, aggregate | Added value, segmentable |
Where to start
Start by taking a pencil and drawing your business data model. It’s like a skeleton — the same kinds of animals have similar skeletons, but every single one is unique. Draw your own, and you’ll see the muscles start growing.
